Plot Channels
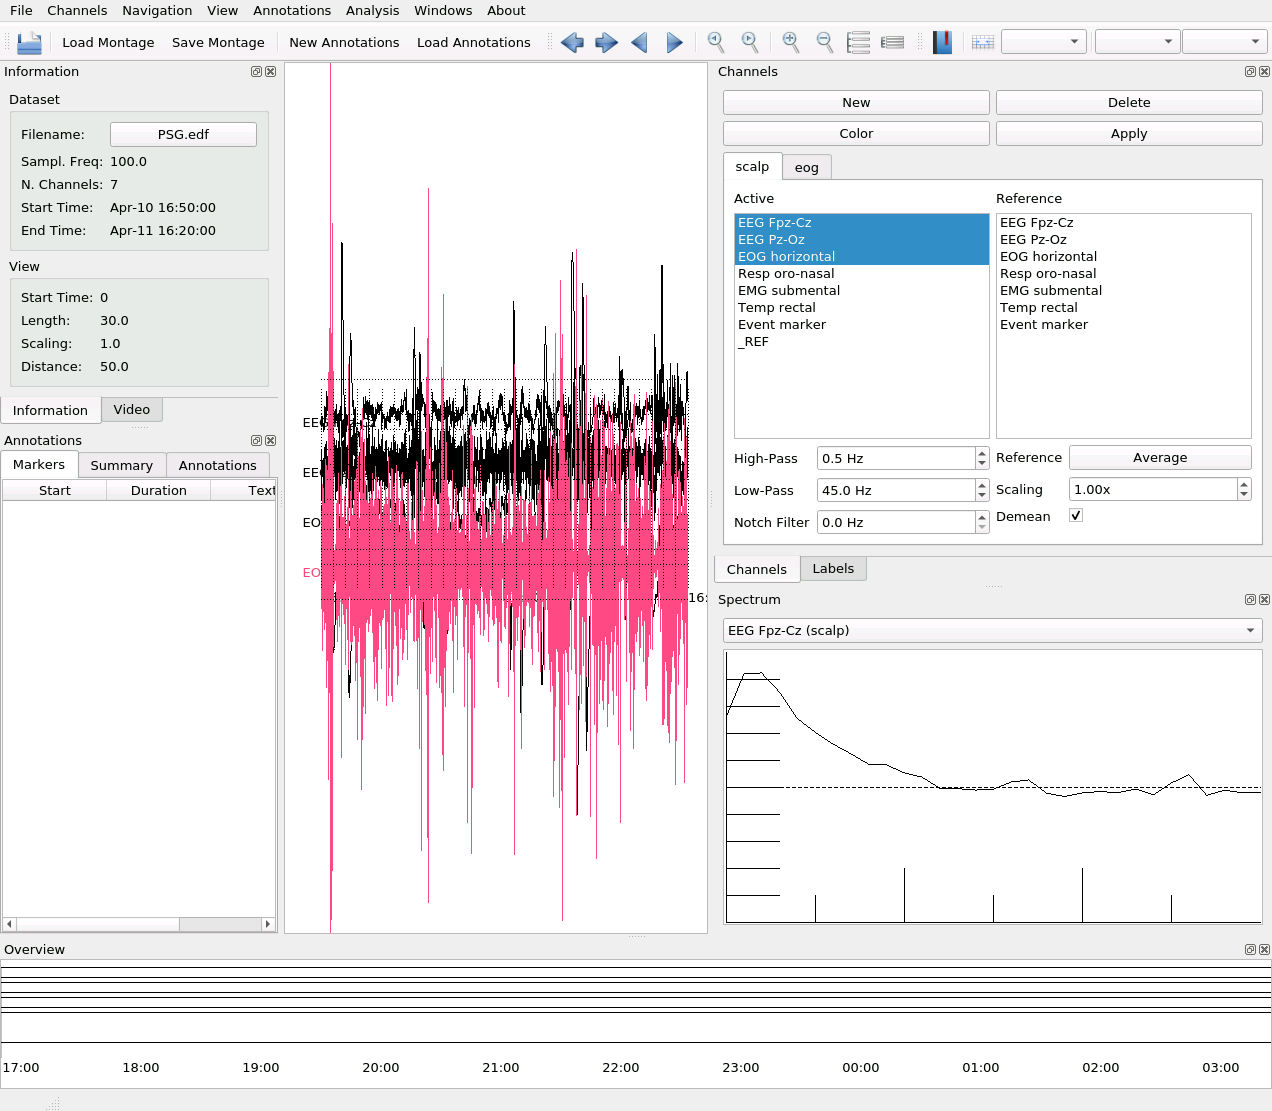
You can create multiple channel groups. Each channel group has its own reference, and filter settings. You can also choose a specific color for each group. Active channels are selected in the left-hand column.
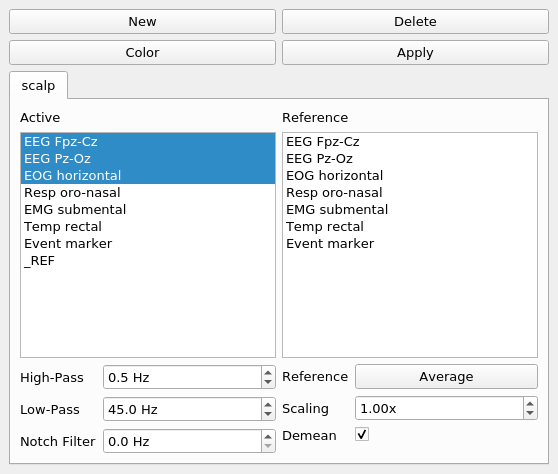
If you click on a single item, the selection is cleared and the new item selected.
Multiple consecutive items can be selected by dragging the mouse over them.
If you press the Ctrl key when clicking on an item, the clicked item gets toggled and all other items are left untouched. In this way you can add one single channel to the selection or remove one single channel from the selection.
If you press the Shift key while clicking on an item, all items between the current item and the clicked item are selected or unselected, depending on the state of the clicked item.
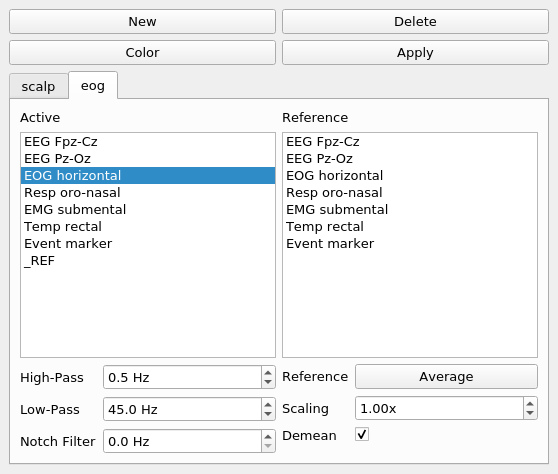
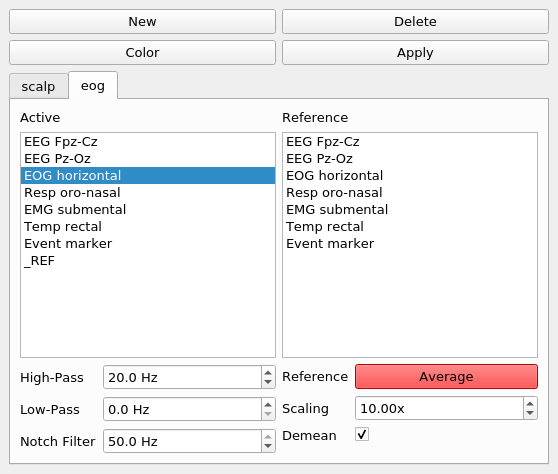
By clicking on New you can create a second channel group, e.g. called eog.
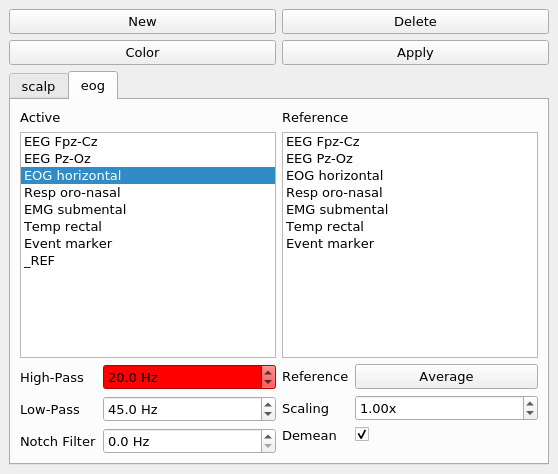
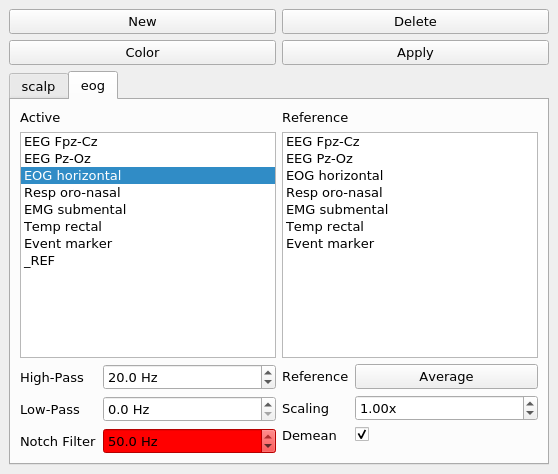
For each channel group, you can modify settings for the high-pass filter:
and low-pass filter:
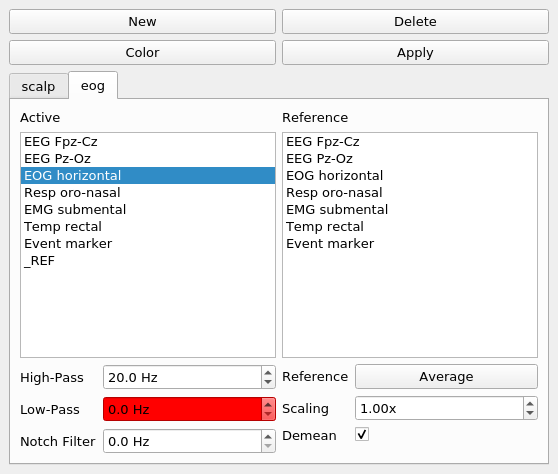
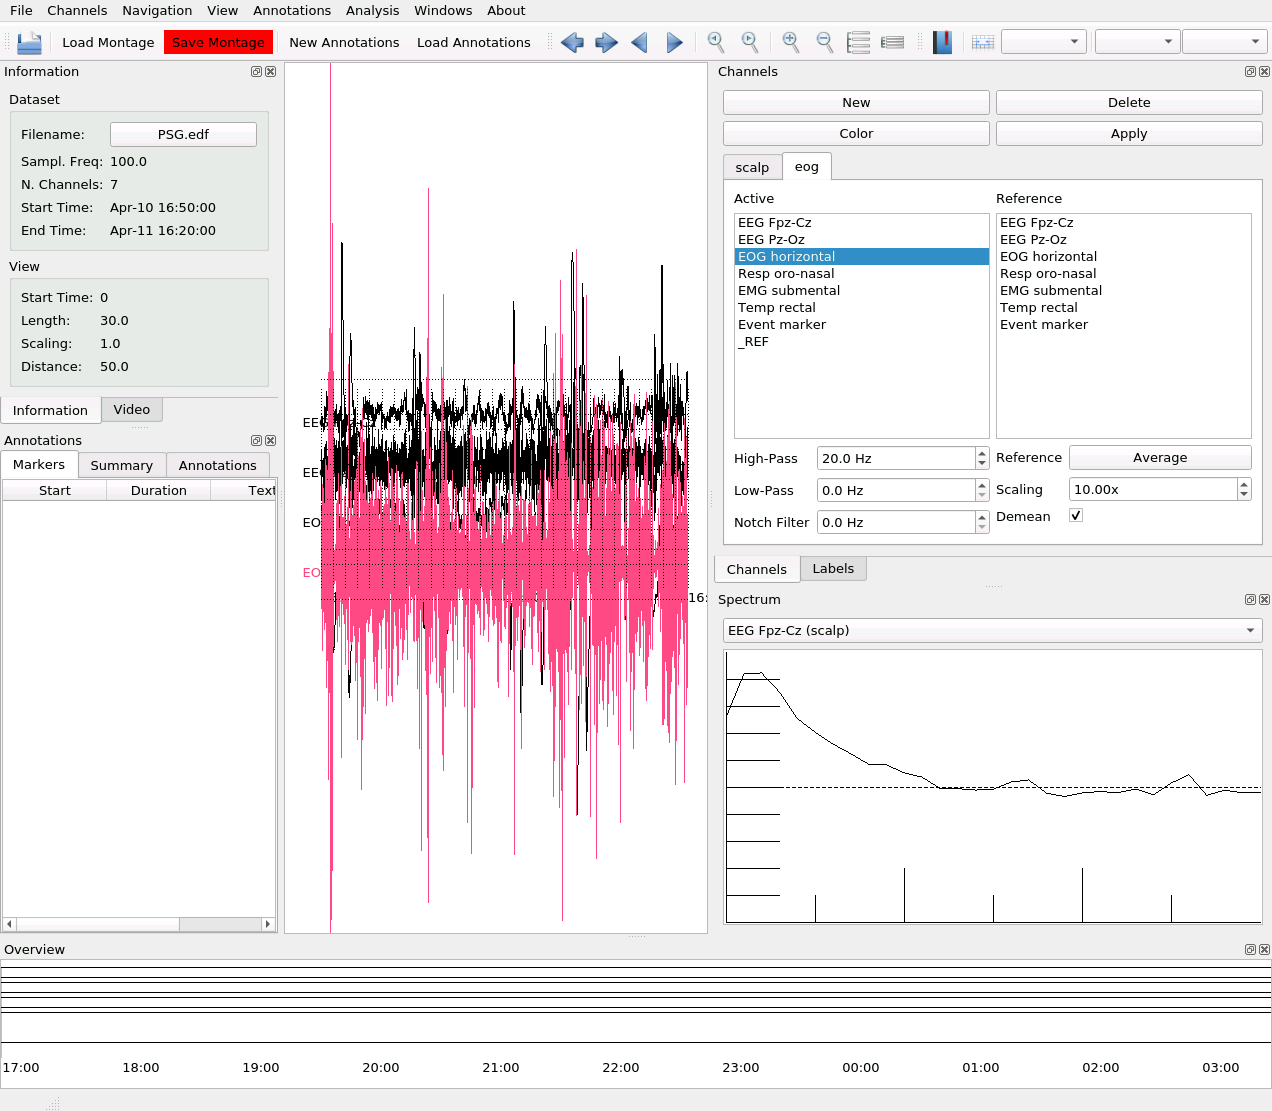
Note
0.0 Hz means that the (high-pass, low-pass or notch) filter won’t be applied.
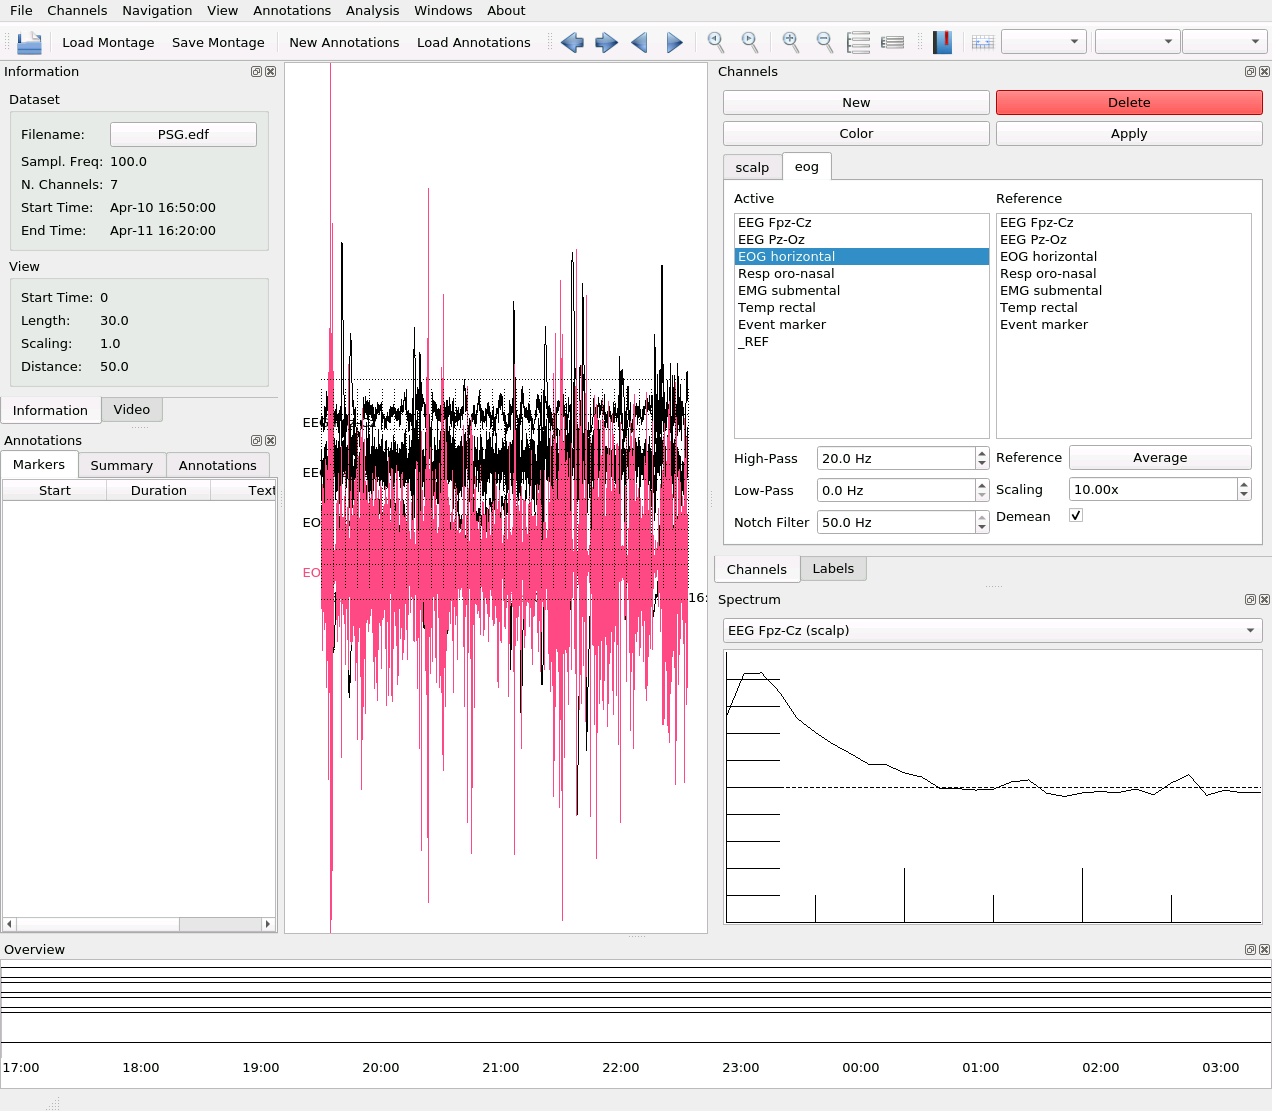
You can also apply the notch filter. Depending on your power line frequency, enter 60 (mostly North and Central America) or 50 (rest of the world).
Note
Because the frequency for the notch filter depends on the country you’re in, you should probably enter the default value for the notch filter in the Settings.
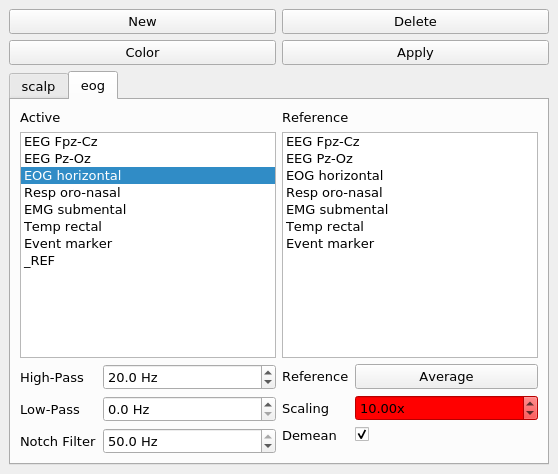
You can also modify the scaling, e.g. if the amplitude of a channel group is too small, you can double the size:
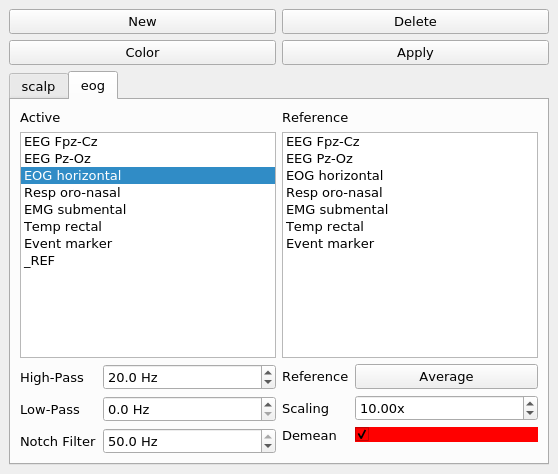
You can remove the mean for each channel group individually. Removing the mean might be useful if your data has a constant offset.
For each channel group, you can specify how to reference the channels, on-line. You can select the individual channels from the right-hand column. If you select more than one reference channel, their average will be taken as the reference:
If you select many channels to plot on the left side, you can click on average and it will select all chosen channels as reference (this is the average reference):
Finally, remember to click Apply so that the changes are applied:
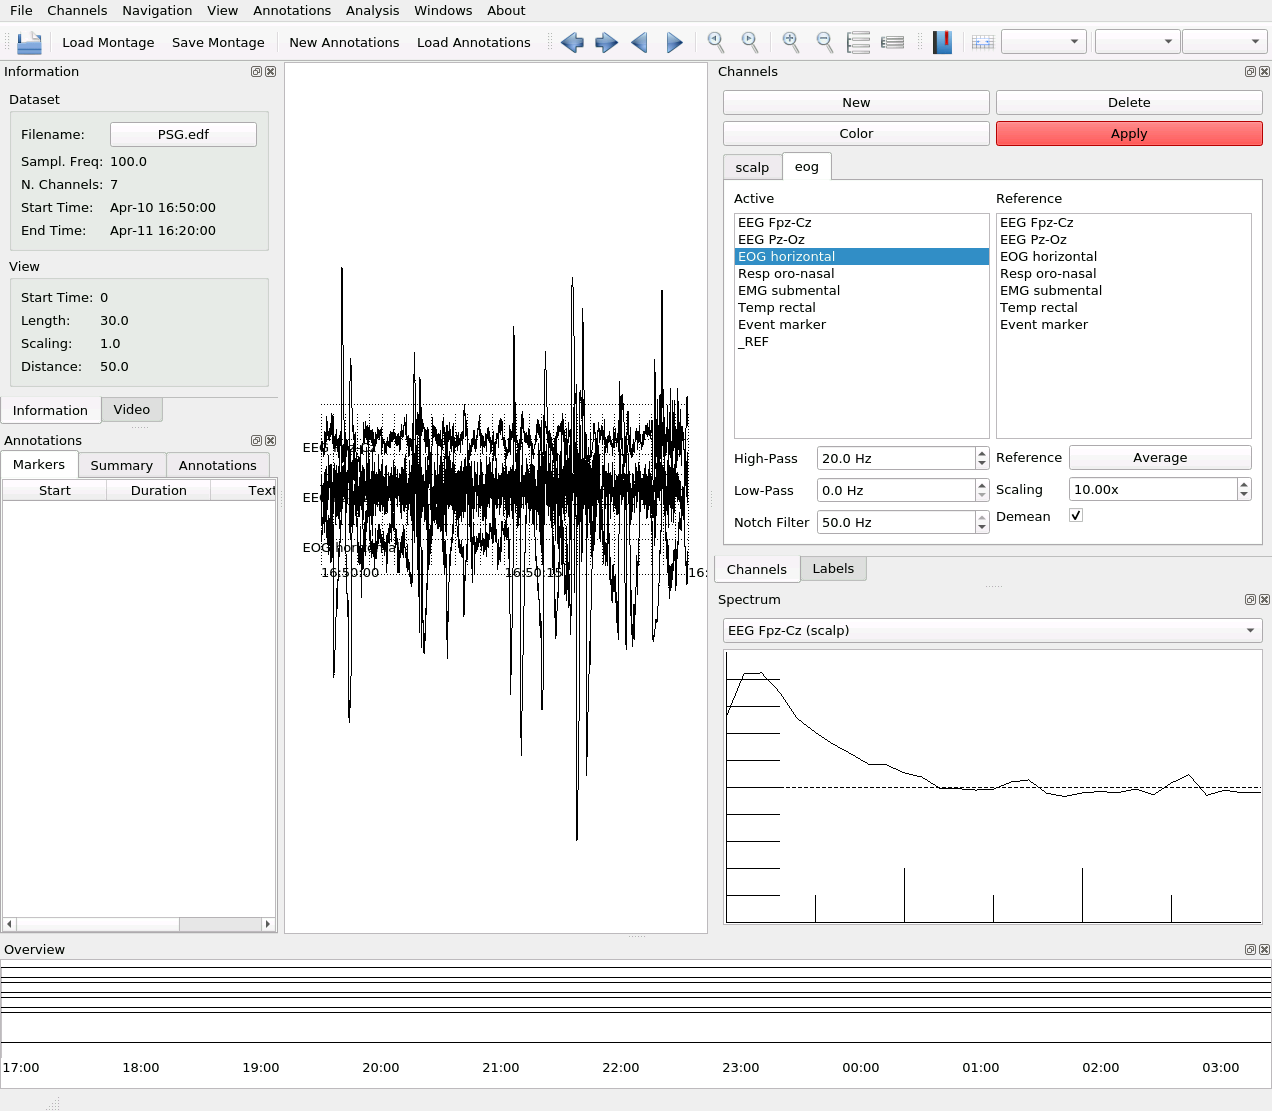
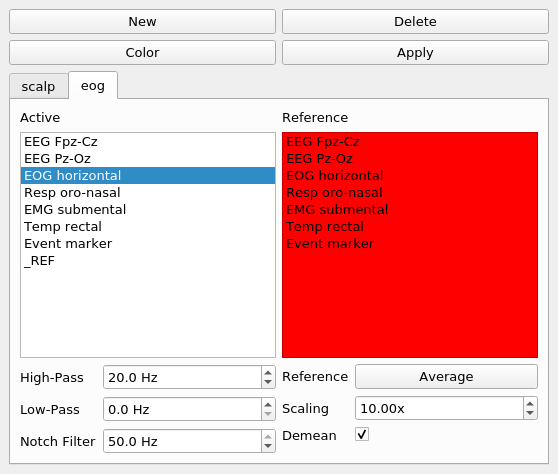
You can also change the color of a channel group, by clicking on Color:
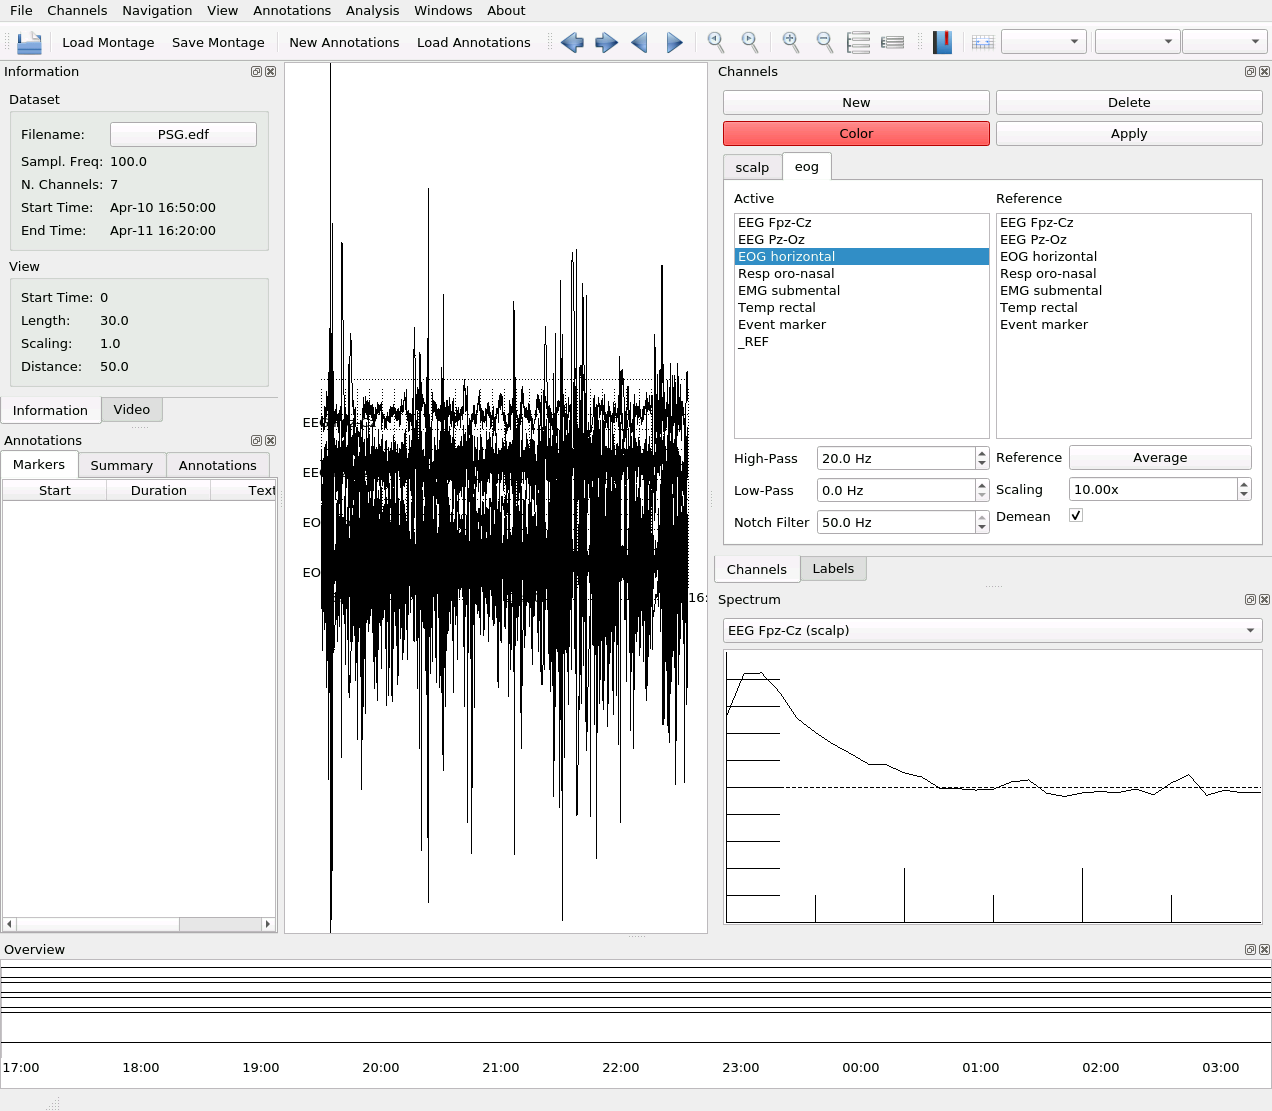
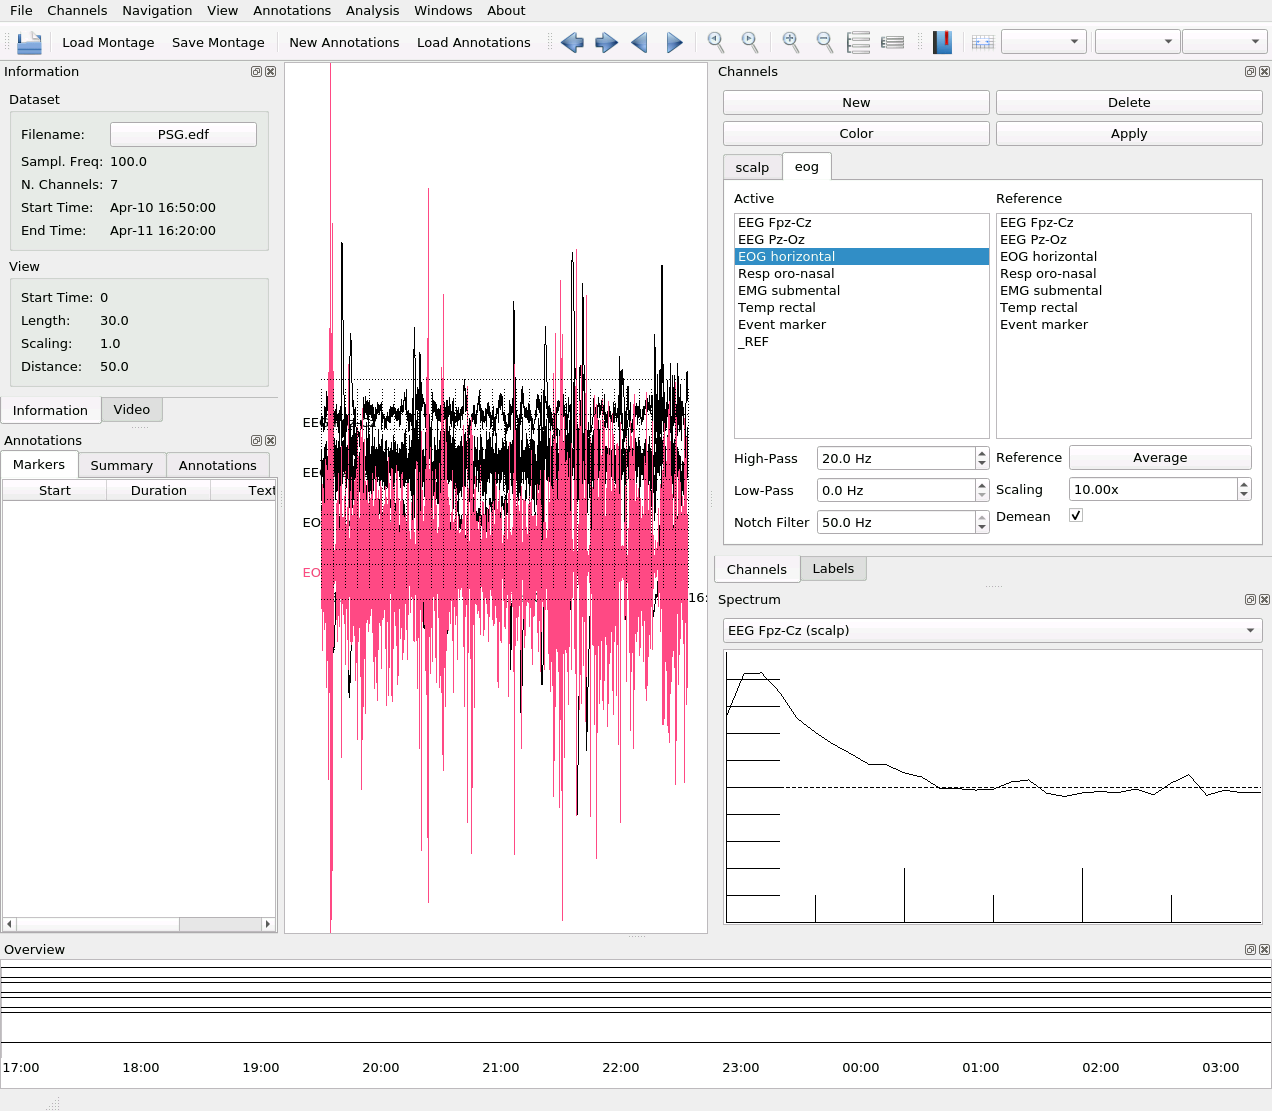
The channels in that group will change color, in this case, red:
Finally, you can also delete a channel group, by clicking on Delete:
Save Montage
If you’re happy with a selection of channels (organized in channel groups, including filter settings and references), you can click on Save Montage:
and you’ll be asked to save the current montage to a file on disk.
Note
The channel montage is stored in the .json format, which is actually a text file, so it’s easy to read and modify if necessary.
Load Montage
Once you reopen the same dataset, you can click on Load Montage:
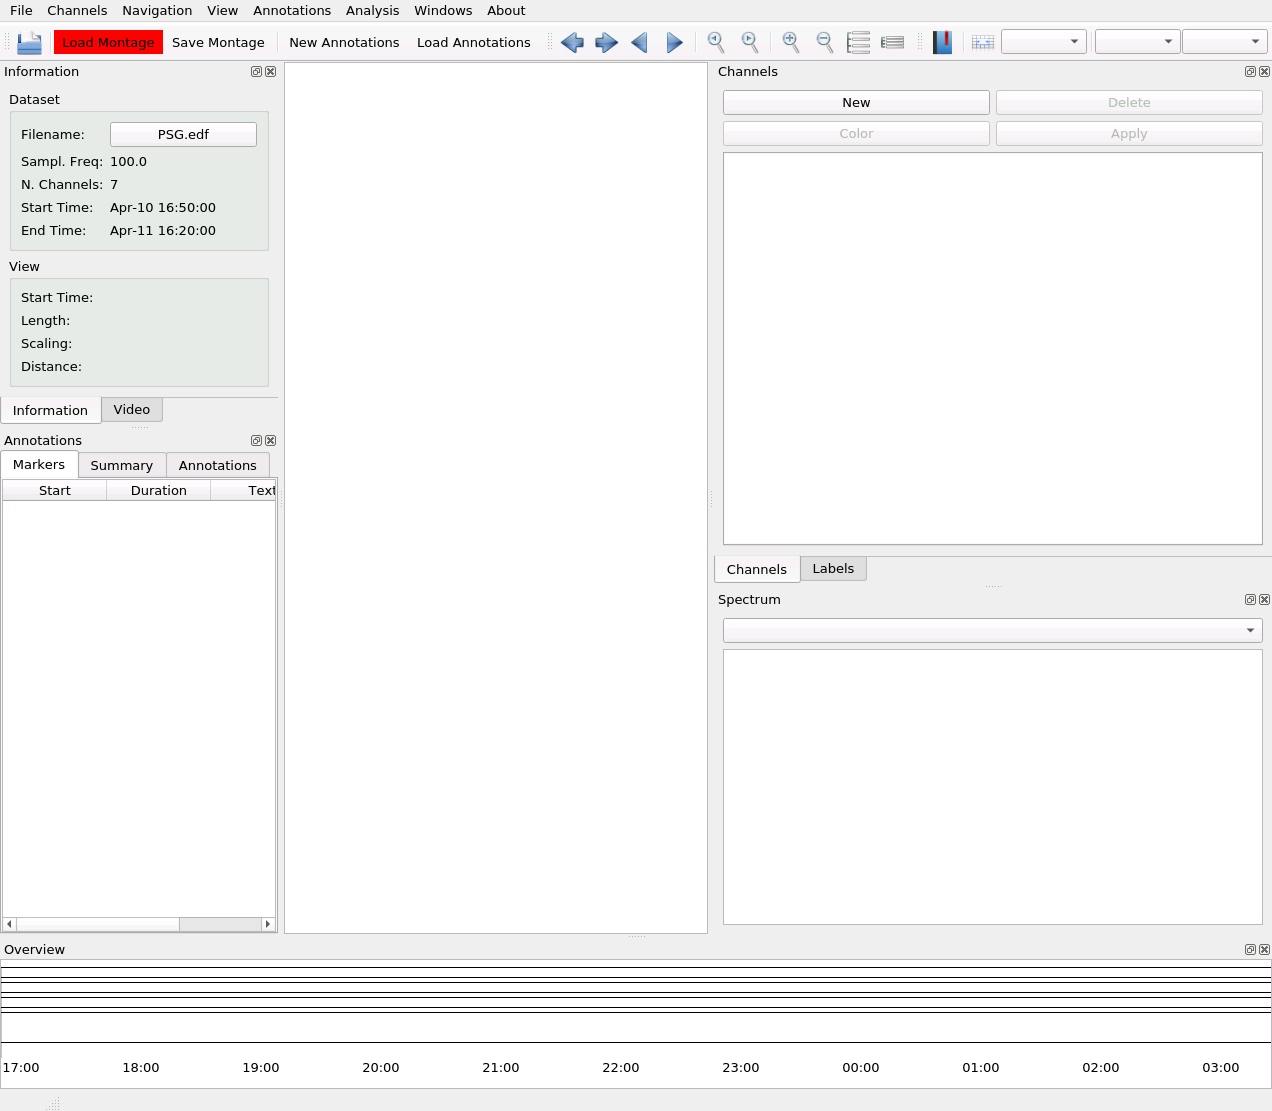
then, the previously saved channel groups will be shown directly:
Note
You can reuse the same channel montage file as long as the channel labels are the same.