Open Dataset
Start the graphical user interface with wonambi from the command line:
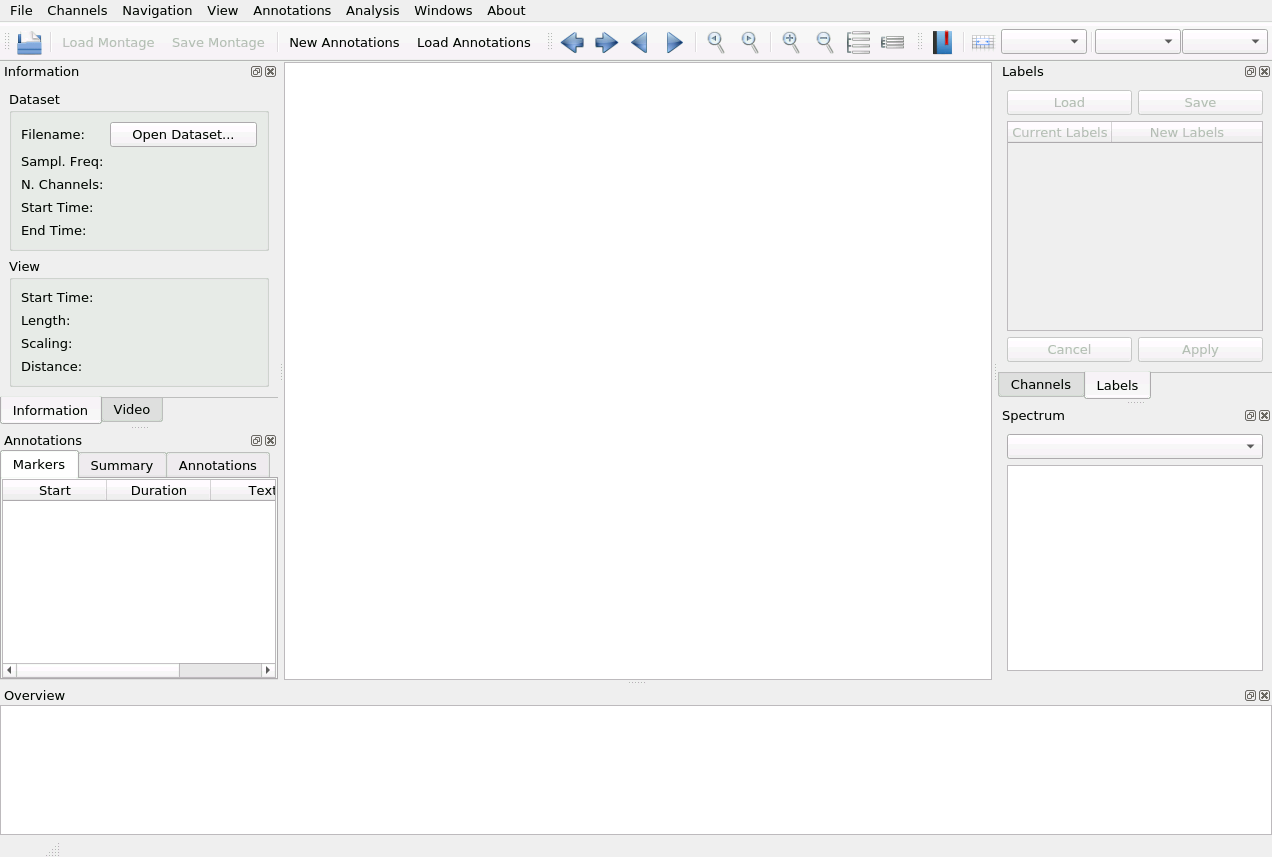
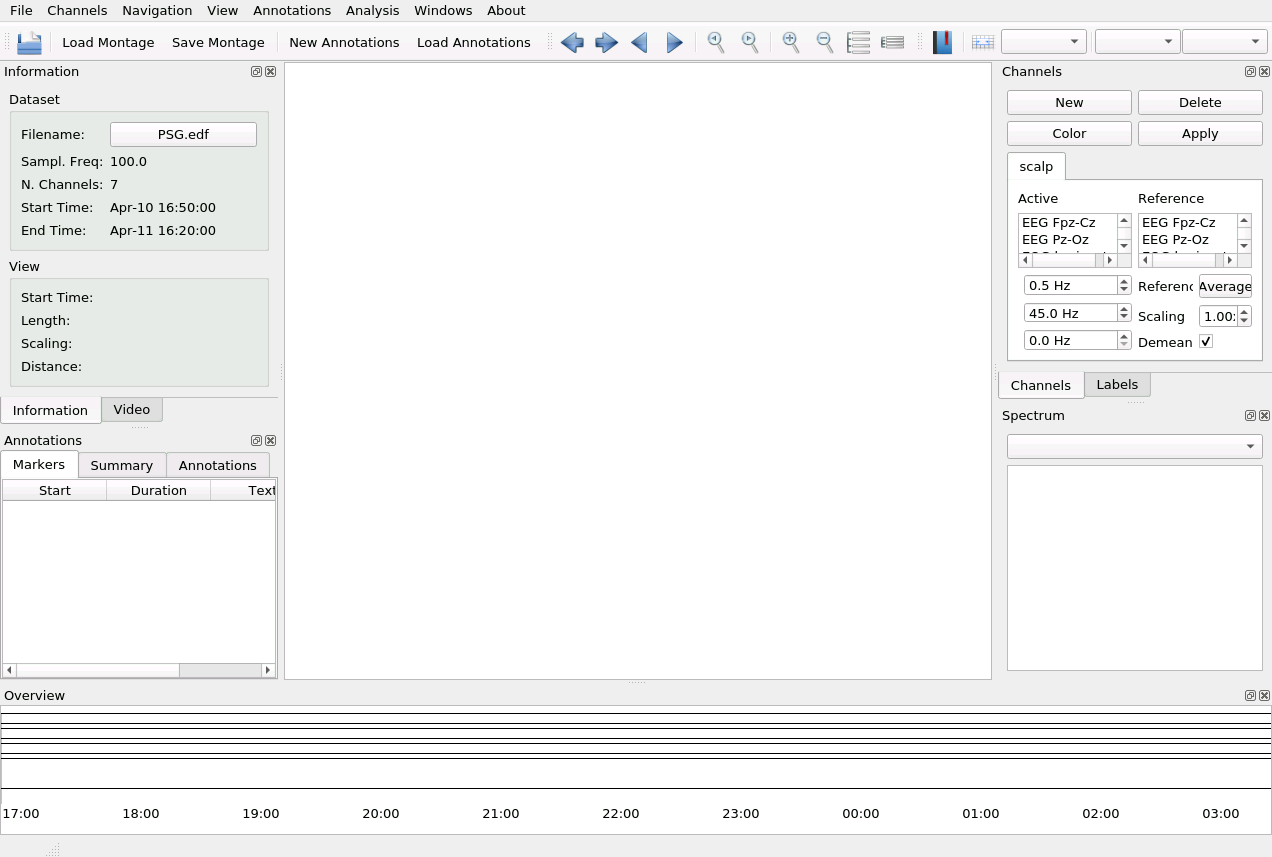
To load a dataset, click on Open Dataset:
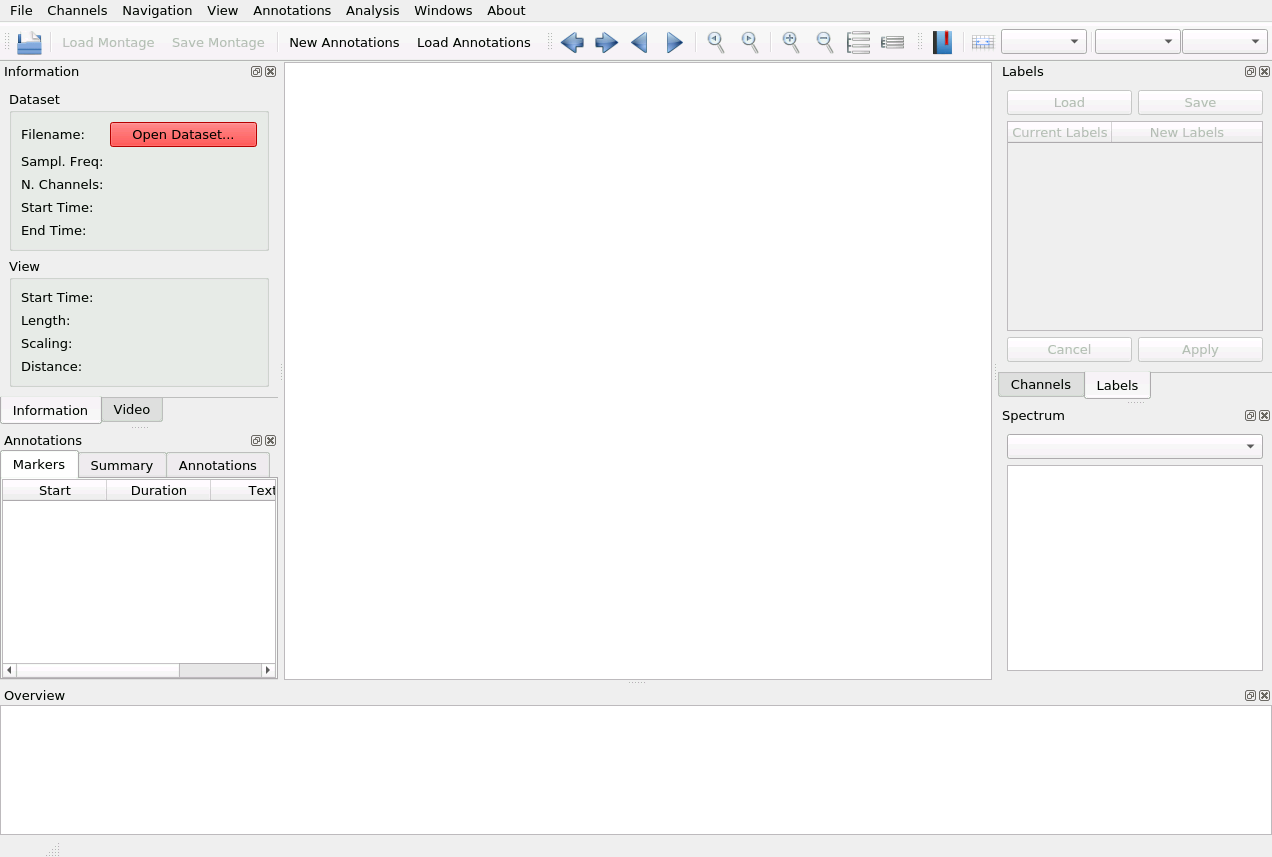
Select if it’s a file or a directory, and select it in the file explorer. The name of the file will then appear in the panel Information -> Dataset -> Filename.
Then, create a new channel group by clicking on New in the Channels panel and give it a name (such as scalp, eog, meg):
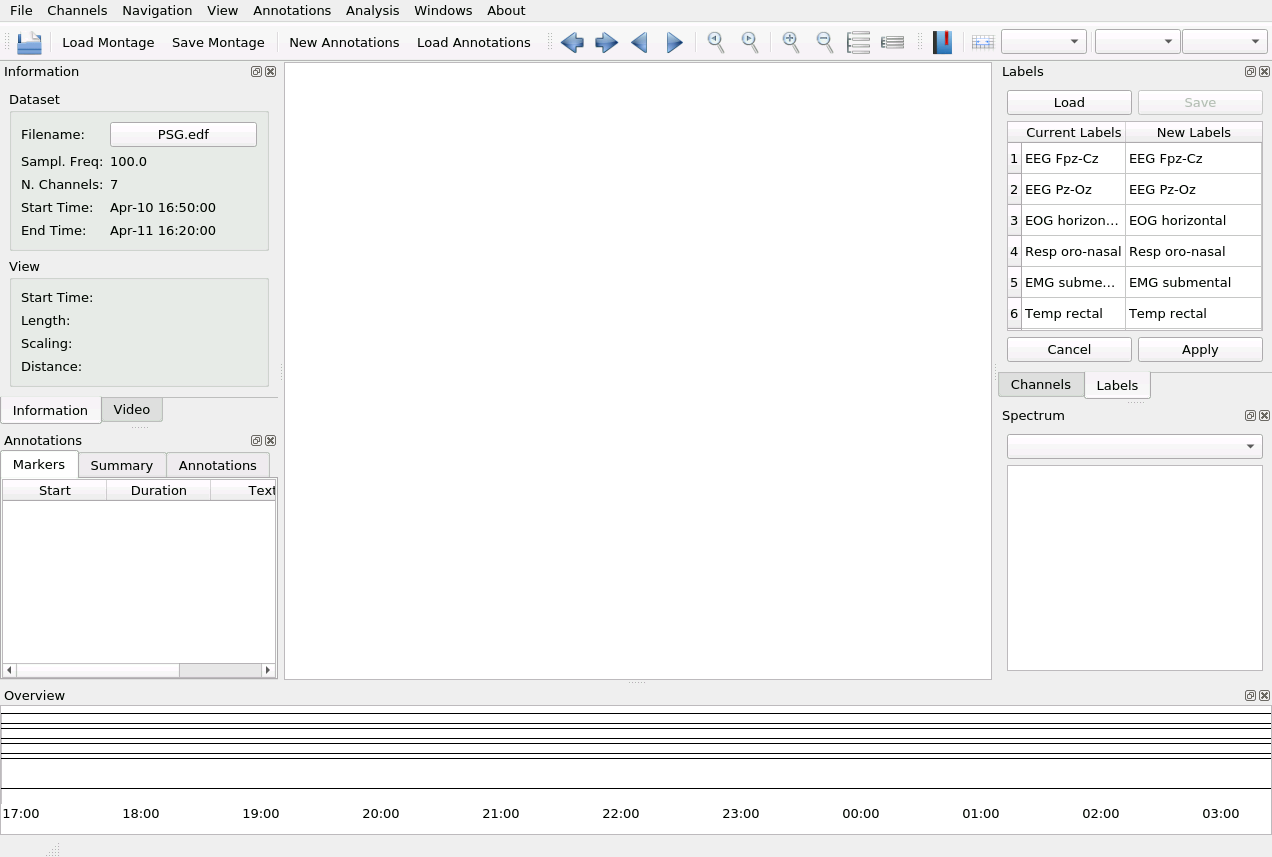
You’ll get the list of channels in the dataset. If you want to edit the labels, see Edit Labels .
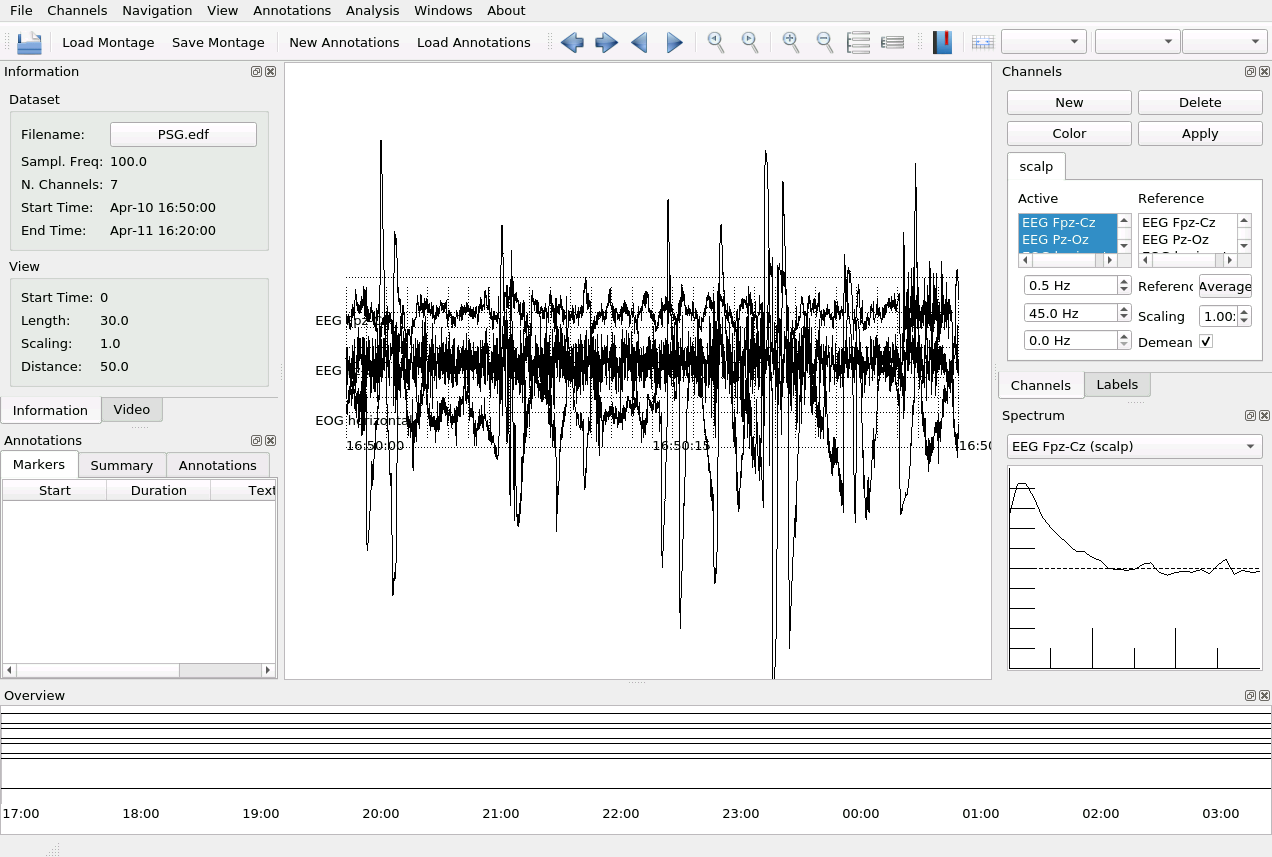
Select the channels you want to plot and click on Apply:
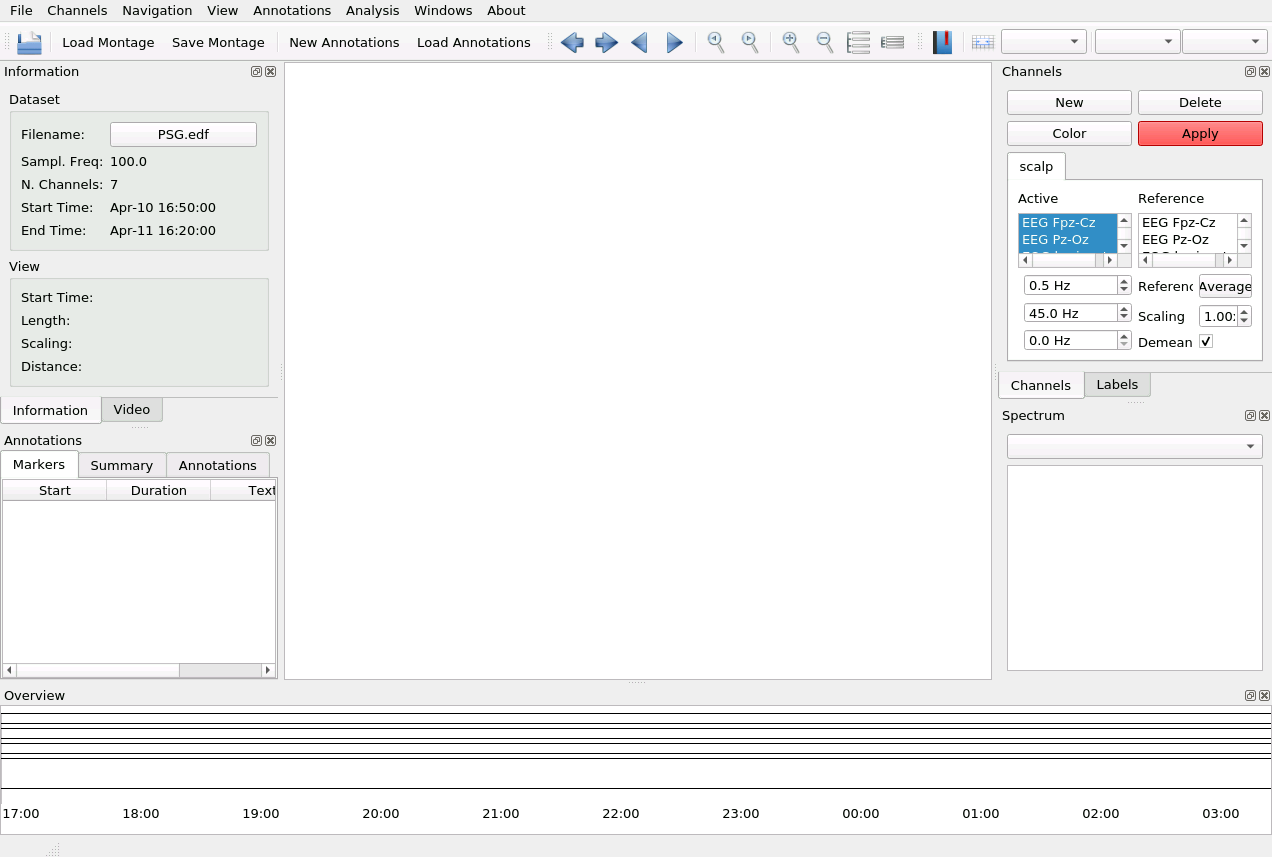
The traces belonging to the channels of interest will appear: